

Far be it from me to leave well enough alone. Let’s amp this discussion up to the next level. **
Part 2 – Advancing the Discussion
In Part 1 of this topic, we demonstrated why multi-tasking is bad for productivity. Some of you will be just fine with that conclusion. You probably are perfectly comfortable waiting for all three columns of the grid to be generated in sequence, and then just accepting the end result.
But what if there was a reason not to be so comfortable with that result? If that were the case, this discussion could get pretty interesting.
Note: If you haven’t read Part 1 yet, you should go back and do that first.
Now that we’re all caught up, recall how in the first two exercises, we concluded that completing the grid by working your way down the columns without switching pens was clearly faster than switching pens to complete the grid row by row. That would seem to present a clear case for completion by column, wouldn’t it?
(BTW, did you really look at the painting that is our featured image? You know what’s in the painting? Columns. Seriously. You can’t make this up.)
Part of the reason columns came out so far ahead had to do with some of the rules we put into place – particularly when it came to the rules about WIP and PROTOCOL where we forced you to put your tools away between steps and discouraged multi-tasking. Those are good rules. They prevent accidents from happening. We want a safe workspace, don’t we? For the purpose of this simulation, we’re not going to debate the rules. Just chalk them up to “that’s just the way we do things around here”.
For the discussion today, we’re going to add a couple more considerations. First, we’re going to start paying attention to “Quality”. Second, we’re going to focus a little bit more on “Customer Satisfaction”.
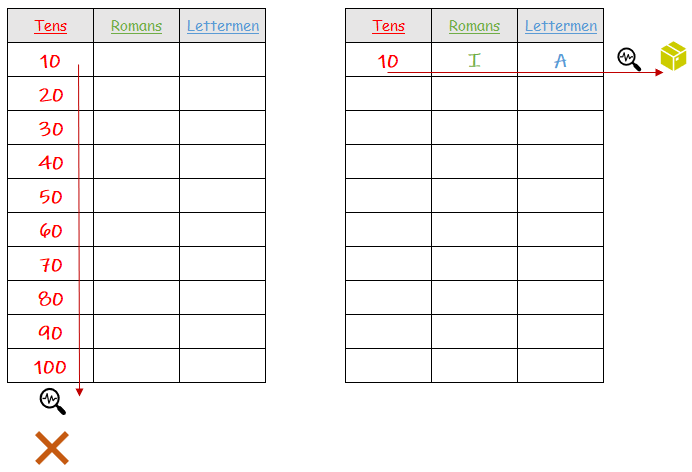
To address our Quality concern, let’s add a simple practice:
VALIDATION: At the end of any one Column (in Exercise 1) or any one Row (in Exercise 2), we need another person to inspect the work, and check it for accuracy before the player can move on to the next step.
To address Customer Satisfaction, we’re going to focus on two concepts:
USABILITY: In order to have a complete experience with the thing we’re building, any one cell of the grid does not make our user happy – it is only one step on a path to happiness. In order to be happy, the customer wants us to adhere to a Definition of Done, and will not accept any piece of our product without the Definition of Done being satisfied.
DEFINITION OF DONE: We therefore cannot make a DELIVERY of any of the ten features we’re developing until the related work across an entire ROW of the grid is complete.
Justification
Think of it this way: pretend column one is “Design”, column two is “Build”, and column three is “Test”. Further imagine that our end product has been divided into ten distinct units of work (features)- and each of these features is independently functional. Our customer won’t be satisfied with a ten-step “Design” (they can’t use a design). And they won’t even be happy once all ten steps being “Built” (does it even work?). They would require that each of the ten features be “Designed”, “Built” and “Tested” before the user would be comfortable using that feature.
Keep in mind that we specified that our ten features are each individually functional, the end user COULD make use of a single feature the moment all three steps in one of the rows is validated. Not only that, but every Row they complete after the first continues to add value for the customer.
Which brings us to the next set of exercises…
Advanced Rules of the Game
Up until now, we have assumed that the work we are doing will be executed perfectly, with no errors, and no accounting for the rework that would follow in the event of an error. (I can tell you from experience creating the visualizations for this blog, I made a few mistakes while reproducing grid after grid…which is what gave me the idea…)
For the next exercises, add the following two rules (See Part 1 for the first 4 rules):
Rule #5: A second person needs to check the accuracy of all values added to the grid since your last inspection. Are they correct? If not, you need to go back and fix the problem then get their approval that it is correct before you can move to the next iteration.
Rule #6: Given our Definition of Done demands that all of the values of a single Row of the grid must be Validated before we consider any of the work on that row to be “Complete”, then answer the question: “Could the customer use this part of the solution?” Hint: for a completed column the answer is “No”.
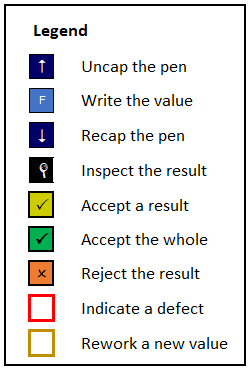
We will be making some simple sequence diagrams below. The legend to the left should help you decipher the diagrams.
Every box in the sequence drawings represents a “unit of time”. Could be a second. Could be an hour. Could be a month. Feel free to use any unit you like. I won’t force you to choose.
Some of the sequence diagrams go a step further and capture some metrics. Mostly, I count the amount of regular work done, and the amount of rework done, so I can maintain a running total of work done, as well as calculate the ratio of Rework to Total Work.
Exercise 3 – Columns with Inspection
Instruct the players to completely fill out the grid, one column at a time, and record the total time it takes to fill out the grid. In this variation, whenever the player completes a column, a second person must inspect their work and validate Rules 5 and 6 have been considered before the player can continue onto the next column.
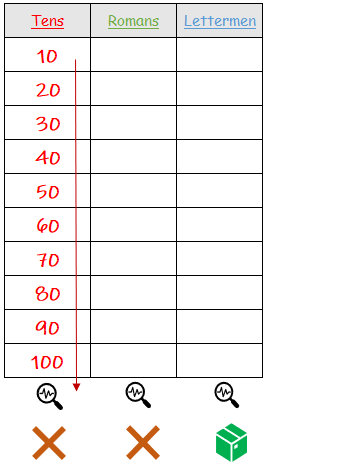
ANALYSIS: This exercise will take a little longer than Exercise 1, but not nearly as long as Exercise 2. Note that at the end of each column, we ask about Rule #6, and because we have no complete rows until we’ve completed the third pass, we have to answer ‘No’ to having deliverable value until the entire grid is complete.
Assuming all goes well, the completion of this grid can be represented like this:
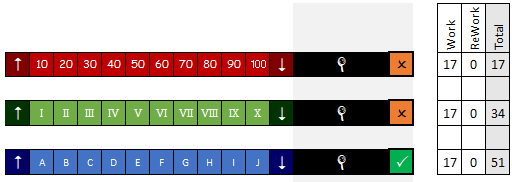
If we pull an inspector into the mix, assuming nothing goes wrong, we will take 51 units of time to complete the grid.
What if there are defects? Say the player can’t remember the proper format of Roman numerals, or they make a mistake while writing down the alphabet and skip a letter. The person doing the inspection would have to call out the errors that occurred in that column, and then the player will have to do some rework, and get confirmation of each fix before they can start the next.
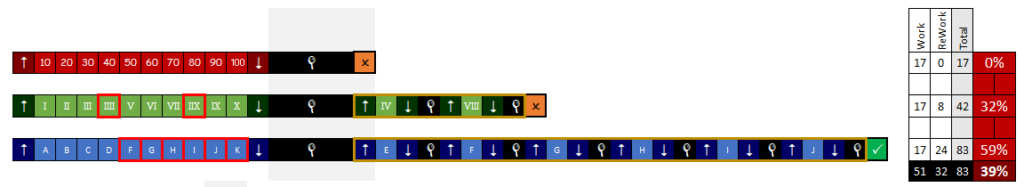
The impact of defects on our flow is substantial, made even more troublesome by the fact that we had to wait to get confirmation of correctness. As we saw with the letters column getting out of sequence, the impact was substantial! Another aspect here is the impact of usability. There were no completed Rows until the very last inspection. Meaning, 0ur end user had to wait 83 units of time to receive their completed, correct grid (instead of an estimated 51), a 39% increase over the original schedule.
We shouldn’t ignore the significance of this. Our project was 32 units of time late. At the expected 51 units, we had nothing to show the customer to give them satisfaction that the project was on track. We ran the risk that the customer might have cancelled the entire thing because they felt no progress was being made!
Exercise 4 – Rows with Inspection
In the previous Exercise, we recognized a terrible truth. Namely that defects can greatly impact delivery. Also, the longer we wait to spot an error, the greater that impact can have on our work. Also, if we don’t focus on completing features to demonstrate some progress, we run the risk of the customer abandoning the project.
Instruct the players to completely fill out the grid, one row at a time, and record the total time it takes to fill out the entire grid. In this variation, whenever the player completes a row, another person must inspect their work and validate Rules 5 and 6 have been considered before the player can continue onto the next column.
ANALYSIS: This exercise will take a little longer than Exercise 2, but you should note that at the end of each row, you have a complete, functioning feature that can be given to the customer, to reassure them, and get further feedback.
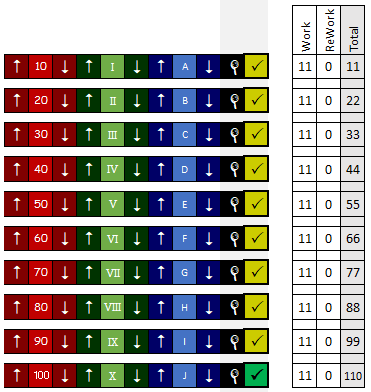
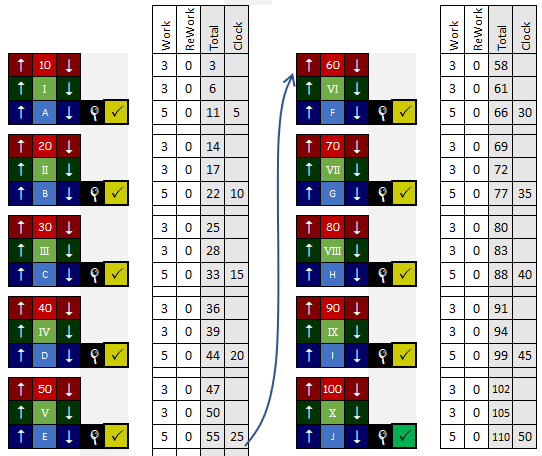
The downside is that due to the task switching, we take longer to deliver the overall grid. Coming in at 110 units of time to deliver the full solution. BUT we were already providing value to the customer after only 11 of those units!
Remember, though that only a few defects had a devastating affect on Exercise 3. How do defects impact us here? So we can make an apples-to-apples comparison, we’ll make the same mistakes…
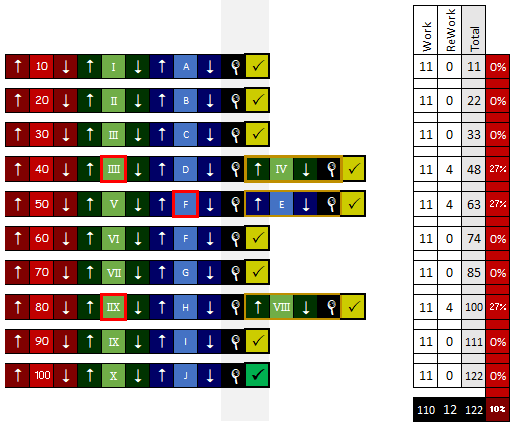
We saw a loss of only 12 units of time during this exercise, because we were finding and FIXING defects almost as fast as we were making them. This had a huge impact on the overall outcome – especially in the letters column. Because we fixed “E” on iteration five, we never made the sequencing mistake in the remaining five iterations, preventing FIVE defects from ever happening!
This is a pretty impressive performance. By taking more time in the creation of our iterations, even though it introduced some inefficiency due to task switching, the benefits of frequent delivery of value, and the lessening of defect impact was significant.
In the best case scenario, with no defects, the cost in clock cycles of execution by Row is more than double the cost of delivery by Columns (110 vs. 51), a 59 unit spread. However, if there are bugs and rework in the mix, the spread (122 vs. 83) yields a 39 unit spread.
Again (and I can’t stress this enough) the biggest impact is in time to first view by the customer. With no defects, by working in columns, the customer gets first peek after 51 units. But when working in rows, the customer gets first peek after only 11 units, and another at 22, and another at 33, and another at 44, etc…
But those results pale in comparison to the two modes with defects. With defects, working by columns, the customer won’t get first peek until 83 time units (in this example). But when working in rows with defects, the customer STILL gets first peek after 11 units!!!
Is the ability to gather faster customer feedback enough to embrace this perceived inefficiency? That’s up to you to decide. But I’ve got another observation that might sway your decision a bit.
Exercise 5: Cross-Functional Team
Rule #2, the one that says a player can only hold one pen at a time is what is causing the capping/uncapping protocol to have a stronger impact on our overall iteration time. There is no way to overcome that deficit with a single person on your team. But what if we had more than one member on our team? Let’s try it out.
Instruct the class to assemble in groups of four. A Numberer with a Red pen, a Roman with a Green pen, a Letterman with a Blue pen, and an Inspector.
Have this team complete the grid, one row at a time. As soon as the three pen-wielding team members have completed their value on each row (and capped their pen), have the Inspector check their work, calling out any defects and allowing the others to fix the mistake before starting the next row. Measure how long it takes to complete the entire grid.
ANALYSIS: One major change here is that the three pen wielders are not required to wait for the other writers to finish. Space permitting, they could even work completely in parallel, each writing their element of the grid row simultaneously. But here is the really interesting part: You are still expending the same number of work cycles to get the work done, but the ELAPSED TIME is shorter. The parallel execution of the writing is shortening our iteration time from 11 units down to as little as 5 units. This cross-functional team is able to match the calendar delivery time of a single person working in columns, while maintaining continuous delivery to the customer, and reducing rework risk through frequent inspections.
Note: Defects will cause the same 4-unit aberration in delivery time as Exercise 4. So the same three defects will still only add 12 units to the overall time.
In Conclusion
As an exercise in sheer speed, working in long columns of delivery initially seemed like the better choice. It got us to a completed grid the fastest. But when we introduced the cost of rework caused by defects, the column method was impacted more dramatically. In Part 2, we’ve shown that working in cross-functional groups by Rows is better at controlling Quality and meeting Customer Satisfaction.
If you’ll allow another slight twist of the plot — In Part 1, when we thought the exercise was writing letters and numbers for units of time measured in seconds, the impact seemed pretty insignificant.
In Part 2, when we switched to calling the three columns Design, Build and Test, the unit of time jumped from seconds to days or even weeks. The impact and difference between the two modes of working took a grimmer turn. Yes, it cost more to work in Rows, but it provided benefits in the form of more security.
Now, I’d like you to imagine one more thing before we close. What if the three columns represented a Database Layer, an Interface Layer, and a Front-End of a data warehouse? Now the units of time are months or years. How long do you think you could keep running a project on that scale without showing progress, or demonstrating a functional integration?
Let that sink in for a moment…
…and with that, I shall bid you adieu. Thank you for your kind attention. Let me know what you think of this in the comments below.
Tens, Romans, Lettermen! Lend me your ears!!!!
Heh. You know what else is in the painting?
Row – mans
The answer was there all along…
** The Advanced Discussion material (Exercise 3-5) is my extension on the original material. I believe the addition of validation and quality rules adds a level of realism to the simulation.